Protests and US Foreign Aid
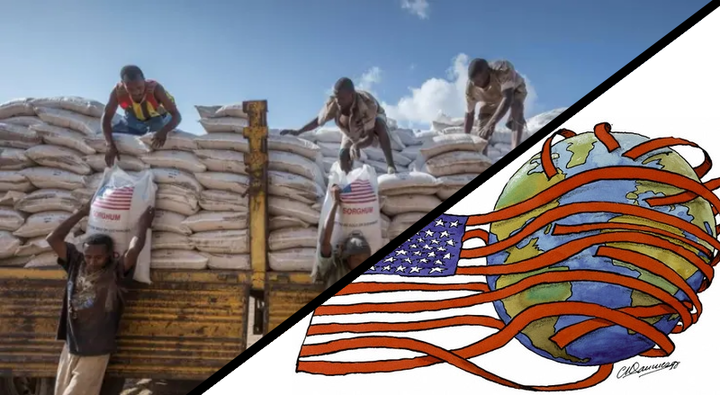
Due to its complex position as the primary world superpower, it’s long been difficult to understand the role the US plays all over the world. Likewise, to know how others feel about the US’s actions would be even more difficult and complex. However, for an oversimplified view of these, I’ve created the following Tableau dashboard, approximating the US’s actions by its foreign aid, and peoples’ feelings on it by their protests.
Explore the dashboard on Tableau Public or embedded below by clicking on one or more countries to view their histories from 1979 to 2014. You’ll see the countries protests each year broken up into those targeting the United States, other countries, and themselves, as well as the total number of protests targeting each country listed separately.
There’s a whole world to explore here, so I’ll only briefly comment on a couple of countries whose plots caught my eye. Particularly Venezuela and Iran, two of the nations most at odds with the US. The patterns of aid seem to support the theory of aid as political manipulation rather than beneficent aid. If you click on Venezuela, you’ll see a striking correlation between the foreign aid in one year, and the protests in the next. Nearly every up and down matches, indicating a strong connection between the two. The most significant protest spikes came in 2007 and 2009, with student protests playing a large role in defeating a 2007 constitutional referendum, but a second referendum passed in 2009 despite even larger protests. The referendum notably eliminated term limits for President Chávez and other officials, signalling a concerning concentration of power.
Given Venezuela’s massive oil fields and authoritarian economic and political structure, if there ever were a regime the US wished to topple, it would be them. While the true purpose of this aid remains unclear due to sparse reporting on the subject, my speculation is that it in each referendum, it was meant to advantage the “no” votes to avoid further power grabs by Maduro. This would be far from a first for USAID, which often pursues political ends under the guise of humanitarian aid. For example, in 2019, USAID sent foreign aid convoys to allies of opposition leader Juan Guaido in an attempt to legitimize him as the US-recognized leader of Venezuela. While those convoys were stopped at the border by Maduro’s troops, who saw the convoy as a violation of their sovereignty, they give some credibility to the political theory of foreign aid over the pure humanitarian theory.
A similar pattern is visible in Iran, another long-time enemy of the United States. In 2008, foreign aid rises from 8 million to 147 million dollars, and then in 2009, protests rise by nearly 10 times, with 5,600 protests observed. These were largely protesting President Ahmadinejad’s clearly fraudulent presidential victory. The protests were ultimately quelled, resulting in Iran’s authoritarian state we see today. If all that US money in 2008 really meant to influence the election, it appears to have been in vain, quietly failing to reach a more US-friendly victory.
For all these simple figures, you may be asking how such information could even be collected. The protest data comes from GDELT, which tracks many kinds of diplomatic actions, protests, and more. Notably, all protests are counted the same regardless of size, though separate events within a protest are added as separate units in my analysis. After subsetting the GDELT data to only protest events, I processed it in R alongside the US government foreign assistance country summary dataset. Tableau made it very easy to combine these two and create the visualizations I wanted out of them.
The overall largest task in this project was getting reliable country names for each protest and its target. Because GDELT labels entities with abbreviations such as “CHNGOV” for the Chinese government, or “CHN” for China in general, but also sometimes just “GOV”, referencing an unknown government, or “OPP” referencing an unknown opposition group. Luckily, they provided coordinates, for each protest’s location and its target’s, nearly all of which I was able to turn into country names over many hours of querying photon.io’s reverse geocoding service. To fix an issue with photon.io outputting each country’s name in its own language, I made a small contribution to the the R package revgeo along the way.